We are independent & ad-supported. We may earn a commission for purchases made through our links.

Advertiser Disclosure

Our website is an independent, advertising-supported platform. We provide our content free of charge to our readers, and to keep it that way, we rely on revenue generated through advertisements and affiliate partnerships. This means that when you click on certain links on our site and make a purchase, we may earn a commission. Learn more.

How We Make Money

We sustain our operations through affiliate commissions and advertising. If you click on an affiliate link and make a purchase, we may receive a commission from the merchant at no additional cost to you. We also display advertisements on our website, which help generate revenue to support our work and keep our content free for readers. Our editorial team operates independently from our advertising and affiliate partnerships to ensure that our content remains unbiased and focused on providing you with the best information and recommendations based on thorough research and honest evaluations. To remain transparent, we’ve provided a list of our current affiliate partners here.

What is a Forming Limit Diagram?

By H.R. Childress
Updated May 17, 2024
Our promise to you
AboutMechanics is dedicated to creating trustworthy, high-quality content that always prioritizes transparency, integrity, and inclusivity above all else. Our ensure that our content creation and review process includes rigorous fact-checking, evidence-based, and continual updates to ensure accuracy and reliability.

Our Promise to you

Founded in 2002, our company has been a trusted resource for readers seeking informative and engaging content. Our dedication to quality remains unwavering—and will never change. We follow a strict editorial policy, ensuring that our content is authored by highly qualified professionals and edited by subject matter experts. This guarantees that everything we publish is objective, accurate, and trustworthy.

Over the years, we've refined our approach to cover a wide range of topics, providing readers with reliable and practical advice to enhance their knowledge and skills. That's why millions of readers turn to us each year. Join us in celebrating the joy of learning, guided by standards you can trust.

Editorial Standards

At AboutMechanics, we are committed to creating content that you can trust. Our editorial process is designed to ensure that every piece of content we publish is accurate, reliable, and informative.

Our team of experienced writers and editors follows a strict set of guidelines to ensure the highest quality content. We conduct thorough research, fact-check all information, and rely on credible sources to back up our claims. Our content is reviewed by subject matter experts to ensure accuracy and clarity.

We believe in transparency and maintain editorial independence from our advertisers. Our team does not receive direct compensation from advertisers, allowing us to create unbiased content that prioritizes your interests.

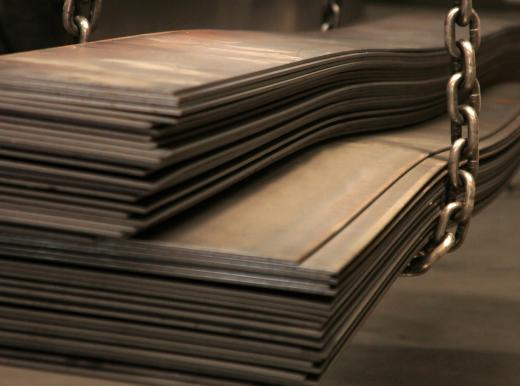
A forming limit diagram (FLD), also known as a Keeler-Goodwin diagram, is a graph that illustrates the behavior of sheet metal under different levels of strain. The line describing the behavior of the metal is called a forming limit curve (FLC). A forming limit diagram provides information on the maximum stress the metal can undergo before fracturing or necking. The diagrams are constructed by using test strips of sheet metal and measuring the deformation.

Forming limit diagrams are graphed in a two-dimensional coordinate system, with the major strain plotted on the y-axis and the minor strain plotted on the x-axis. Strain is a measure of the deformation — major strain is defined as being in the direction with higher deformation, while minor strain is in the direction with less deformation. Different types and different thicknesses of sheet metal each have their own unique forming limit diagram.
An FLC is an irregular parabolic curve, with the minimum occurring at or near the major strain axis. A material subjected to strains that lie above the curve will fail, while strains below the curve are safe to apply to the metal. FLDs are usually graphed with two curves — the area between the curves is a zone of critical deformation or safety zone, where the material may be safe or may crack, so in practice it is best not to apply those strains. The critical deformation that is likely to occur in this zone is called necking, which is when the metal is stretched thinner in some areas.

A forming limit diagram is developed using a series of tests. During the tests, strains are applied to metal strips of differing widths. The different widths of strips simulate different strain conditions. Each strip is marked with a circular grid pattern that is used to measure the strain.

Strain is usually applied to the strips using a hemispherical punch. A metal strip is stretched until necking is observed. Strain values for the major and minor axes can be obtained by measuring the deformation of the circular grid previously marked on the strip.

Computer-based methods may also be used for measuring strain. Images taken by the computer during the deformation process can be compared to a reference grid comparable to the circular grid on the metal. The computer can compute the strains using these images. Another method compares before and after images of the circular grid in order to calculate strain.

AboutMechanics is dedicated to providing accurate and trustworthy information. We carefully select reputable sources and employ a rigorous fact-checking process to maintain the highest standards. To learn more about our commitment to accuracy, read our editorial process.

Discussion Comments

By everetra — On Oct 31, 2011

@Charred - I can’t speak to the science behind the steel collapses in the terrorist attacks. I do know that metal fabricators use a variety of metal forming techniques to shape the steel into a particular shape.

From what I understand some of these methods use cold as part of the process while others use heat. I don’t know how much heat is applied using the heat techniques, but I assume that during this process they have an acceptable threshold for how much heat the metal can endure.

Again, whether the steel can withstand more than that or whether the fires of September 11,2001 were much hotter than that threshold, I cannot stay. But the metal fabricators do run their tests through a variety of what-if scenarios as I understand it.

By Charred — On Oct 30, 2011

I think that the forming limit diagram is useful for determining how much strain sheet metal can take, but of course custom metal fabrication cannot take into account all possible variables in advance.

For example, they may want to make steel to use in building construction. They have to anticipate how much weight is put on the metal through normal usage. But what if something spectacular happens that puts undue strain on the steel?

After the September 11,2001 attacks for example, there was considerable speculation as to why the buildings fell given the tensile strength of the steel.

Some said the metal should have stood up under the strain of the two airplanes, while others argued otherwise. Detractors became conspiracy theorists as a result.

From my understanding, it was the heat of the airplanes and not just their weight that caused the building to collapse. No one could have anticipated this.

AboutMechanics, in your inbox

Our latest articles, guides, and more, delivered daily.

AboutMechanics, in your inbox

Our latest articles, guides, and more, delivered daily.